Agent analytics
Written By Stanislas
Last updated 16 days ago
Overview
Agent analytics provides a dedicated observability dashboard for each custom AI agent in Swiftask. It centralizes real-time metrics on usage volume, completion rates, member adoption, and error distribution.
You should use agent analytics to monitor how frequently an agent is utilized, track credit consumption across execution channels, detect prompt inefficiencies, and troubleshoot execution errors before they impact operations.
Prerequisites
To view an agent's analytics dashboard, you need:
An active account in a Swiftask workspace with access to the agent.
Agent creator or workspace administrator permissions to edit and configure the agent.
At least one configured custom AI agent.
Step-by-step guide
1. Access the agent analytics dashboard
In the Swiftask sidebar, click Agents and select the agent you want to inspect.
Click the configuration icon to open the agent configuration workspace.
In the left navigation panel, scroll down to the Observability section.
Click Analytics.

2. Review top-level performance indicators
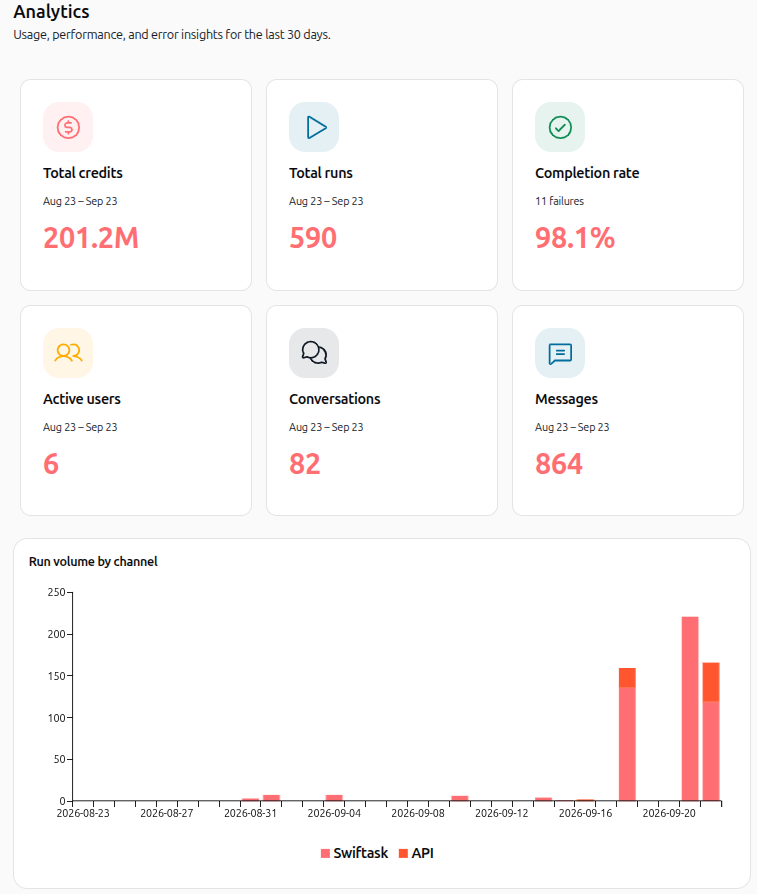
The dashboard header displays the agent name along with 6 summary KPI cards calculated over the last 30 days:
Total credits: Total AI and tool execution credits consumed by the agent.
Total runs: Total number of execution runs triggered across all entry points.
Completion rate: Percentage of runs completed successfully, including the absolute count of failed runs.
Active users: Number of unique workspace members who interacted with the agent.
Conversations: Total number of distinct conversation threads initiated with the agent.
Messages: Total volume of individual messages processed by the agent.
3. Analyze run volume by channel
The Run volume by channel chart visualizes daily execution volume broken down by origin:
Swiftask: In-app chat interactions within the Swiftask interface.
API: Executions invoked through the Swiftask REST API or SDK integrations.
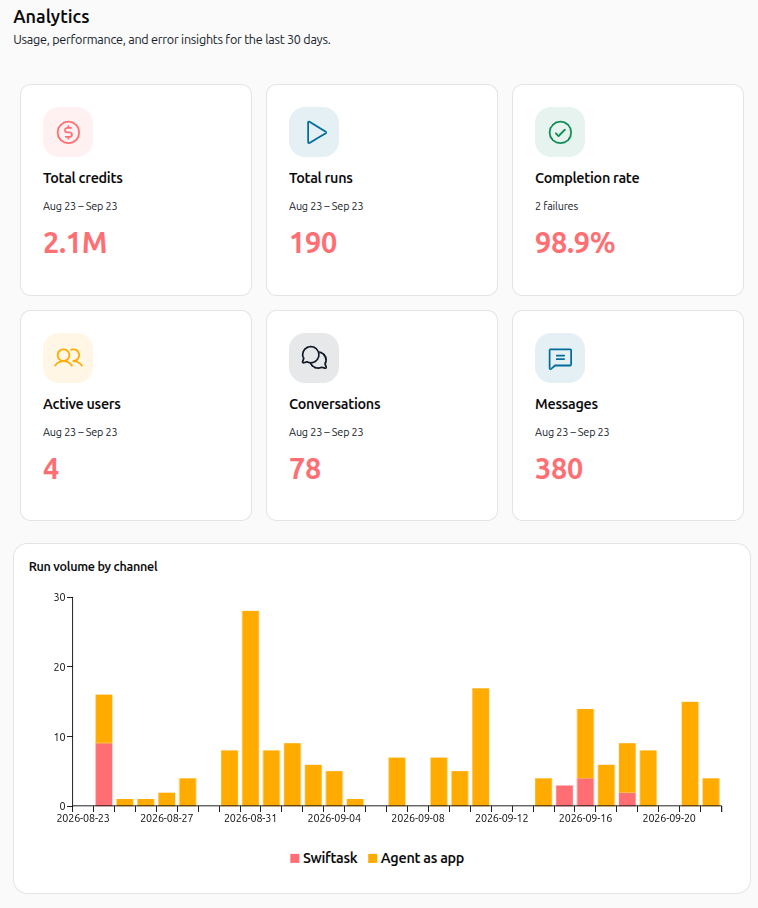
Agent as app: External conversations generated via standalone shared agent web apps.
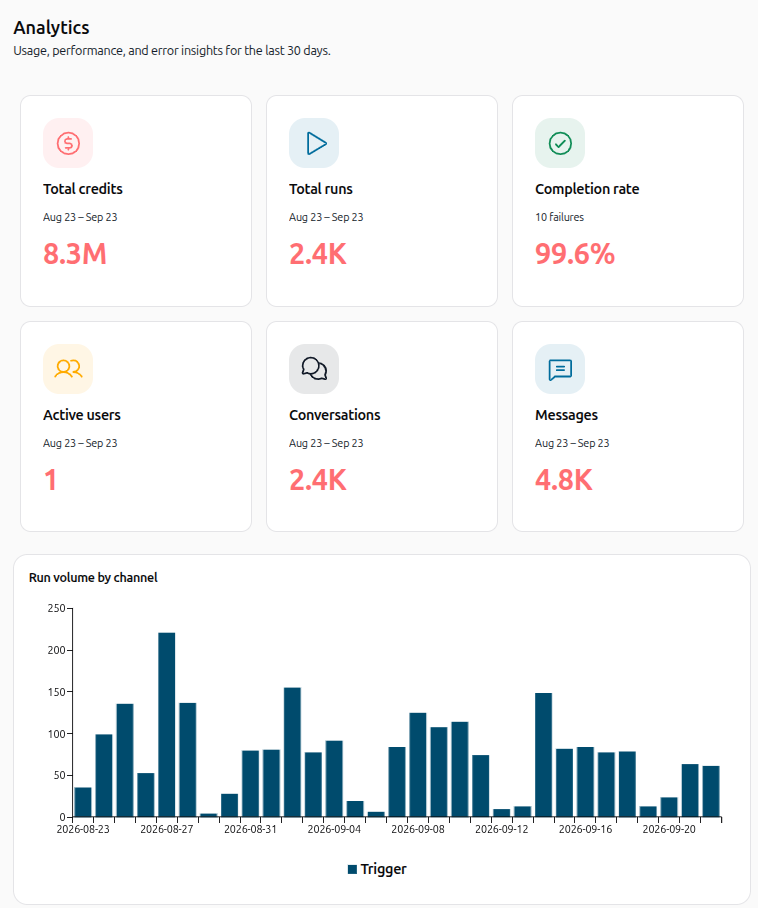
Trigger: Automated runs triggered by webhooks, scheduled tasks, or inbound emails.
4. Inspect detailed trends, status, and errors
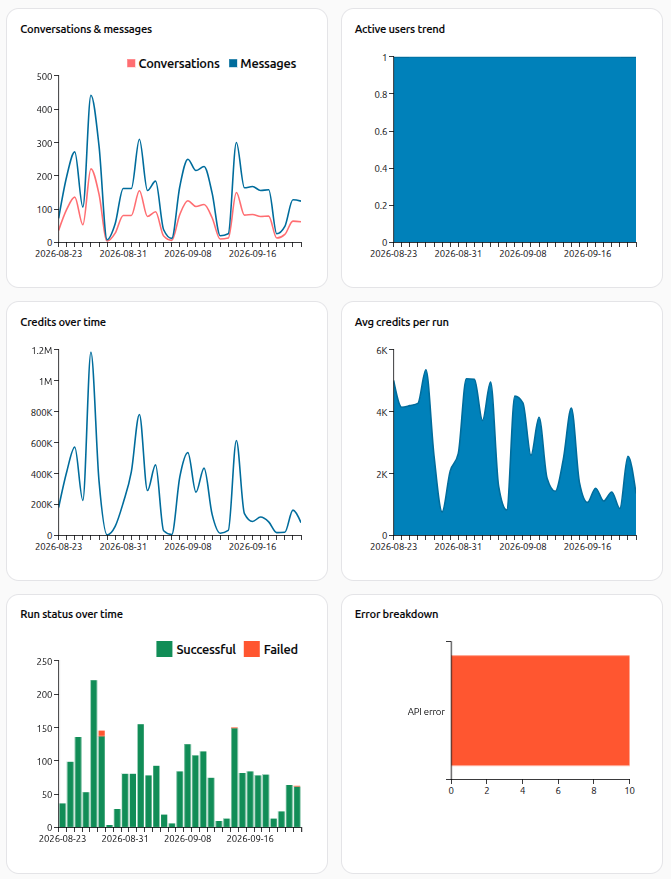
Scroll down to inspect long-term health and efficiency metrics:
Conversations & messages: Dual-line graph tracking conversation count against total message volume over time.
Active users trend: Area chart showing daily active user count to measure team adoption.
Credits over time: Line graph highlighting daily consumption trends and cost spikes.
Avg credits per run: Area chart tracking average credit consumption per individual run. Sustained increases indicate expanding context windows or heavier tool payloads.
Run status over time: Stacked bar chart comparing daily Successful runs against Failed runs.
Error breakdown: Horizontal bar chart categorizing failure reasons such as API error, Out of credits, or Other.

5. Review dashboard variants by deployment type
Depending on how your agent is deployed, your channel breakdown and usage patterns will reflect distinct operational variants:
Variant: Public web application (Agent as app)
Agents deployed as standalone web apps show execution volume concentrated under the Agent as app channel, with user engagement spread across external sessions.

Variant: Automated background agent (Trigger)
Agents triggered by webhooks or automated workflows display execution volume under the Trigger channel, characterized by high run counts originating from automated pipelines.
Practical use cases
Spotting prompt bloat and inefficient context
An agent creator notices that while total runs remain stable, Avg credits per run has doubled over the past week. By checking the chart, they determine that expanded system instructions or oversized file uploads are increasing token costs, allowing them to optimize the prompt.
Investigating sudden execution failures
A team notices automated customer workflows failing. The creator opens Run status over time and identifies a surge in failed runs. The Error breakdown chart reveals these were caused by Out of credits, allowing the admin to replenish credits immediately.
Measuring agent adoption across departments
An operations lead deploys a new documentation agent. By checking the Active users trend and Conversations & messages graphs, they evaluate weekly adoption growth across the workspace.
Tips & best practices
Monitor average credit trends: Regularly check Avg credits per run to catch expensive prompt loops or unnecessarily large tool outputs early.
Cross-reference failure spikes: When the completion rate drops below 95%, review the Error breakdown chart to identify whether the cause is an external API outage or credit depletion.
Correlate channels with credit burn: Compare Run volume by channel with Credits over time to pinpoint whether API integrations or chat sessions drive the bulk of your budget.
Troubleshooting
Issue: The analytics tab displays zero runs or empty charts
Cause: The agent has not been executed within the last 30 days, or runs were made under a different workspace environment.
Fix: Trigger a test conversation with the agent in Chat or through its configured trigger. Allow a few moments for the data to refresh.
Issue: Frequent "Out of credits" errors in the error breakdown
Cause: The workspace credit allocation has been fully consumed, or the agent reached an assigned credit limit.
Fix: Navigate to Workspace settings → Subscription to purchase additional credits or adjust individual member allocation limits.
Issue: High rate of "API error" failures
Cause: Connected third-party skills, webhooks, or underlying model endpoints are unreachable or improperly authenticated.
Fix: Navigate to the agent's Skills settings, test tool connectivity, and verify active API credentials.
Additional resources
Sessions & Inbox – Inspect conversation transcripts, execution traces, and detailed run logs.
Agent settings – Configure agent instructions, model selection, and execution behavior.
Tracking your consumption – Monitor workspace-wide credit usage and billing details.
Agent as app – Share and deploy agents as standalone web applications.
Was this helpful?
Still need help? Ask the team